

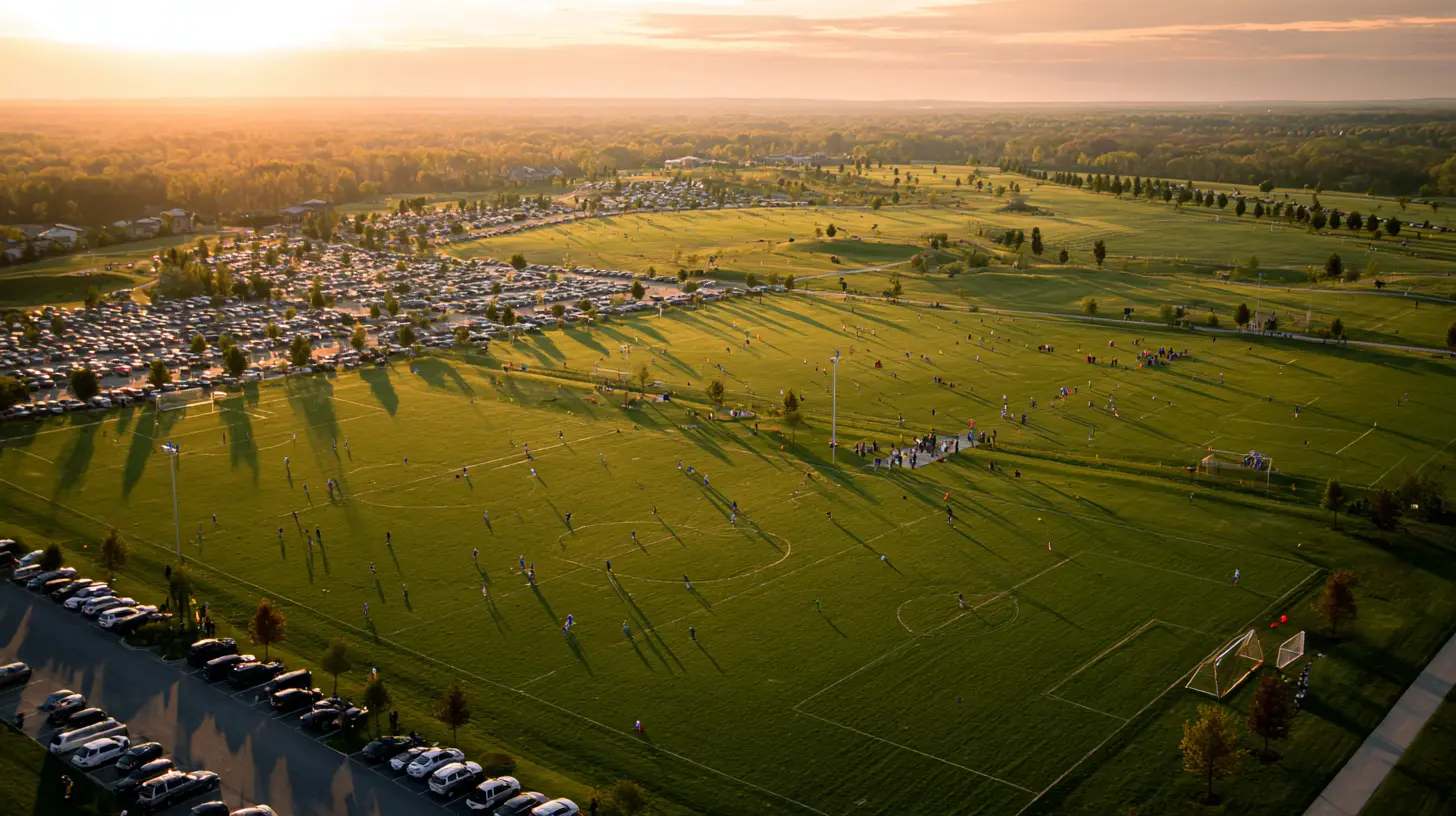
Nobody tracks every kid who kicks a ball in the backyard. Or the driveway. Or a parking lot with a trash can for a goal. Registration numbers capture the organized universe - travel clubs, rec leagues, school teams - but millions more play outside those systems. Using Census data, registration counts, and survey-based participation rates, we built a simple estimator to bracket the real number. The answer is bigger than you think.
5.9 M
Base estimate
U.S. kids playing soccer
2.8 M
Organized core
USYS + AYSO (adj.)
73.8 M
U.S. children
Under 18
2.1x
Multiplier
Base vs. organized core
The top-line answer
Our best estimate is that roughly 5.9 M American children play soccer in some form. That is about 8 out of every 100 kids under 18. The range runs from 4.4 M under conservative assumptions to 7.4 M under generous ones. In every scenario, the total is significantly larger than the 2.8 M players captured in organized registration systems.
The visible soccer universe
Start with what we can count. US Youth Soccer (USYS) registers about 2,500,000 players per year. The American Youth Soccer Organization (AYSO) adds roughly 400,000. High school soccer accounted for 851,378 participants in the 2023-24 season (467,483 boys, 383,895 girls), per the NFHS participation survey.
Since many AYSO players also register with USYS clubs, we apply an 80% overlap factor to AYSO's count. That gives us an organized core of roughly 2.8 M registered youth players: USYS (2,500,000) plus the adjusted AYSO contribution (320,000). High school participants are largely already counted in one of these systems, so we do not add them separately.
Why the true number is bigger
Registration systems miss a lot of soccer. Pickup games in parks. Intramural leagues at schools. Church leagues. Backyard 1v1 against your older sibling who will not stop slide tackling on concrete. Informal rec programs that never affiliate with USYS or AYSO. In lower-income communities especially, organized registration is a financial barrier that filters kids out of the official count without filtering them out of the sport.
National survey data from the Sports & Fitness Industry Association and the Aspen Institute consistently find total youth soccer participation rates in the 6-10% range. These surveys count anyone who played soccer at least once in the past year - a broader but more honest definition of "plays soccer."
From all U.S. children to soccer players
Base case. The gap between "estimated total" and "organized core" represents kids playing outside USYS and AYSO registration systems.
The estimator
The Census Bureau estimates 73.8 M Americans are under 18. Apply a participation rate to that population and you get a total estimate. We run three scenarios:
- Conservative (6%): Only kids who play regularly in organized settings. Produces 4.4 M players.
- Base case (8%): Includes regular participants in both organized and informal play. Produces 5.9 M players.
- High case (10%): Includes occasional and casual participants - anyone who played soccer at least once in the past year. Produces 7.4 M players.
The organized core of 2.8 M forms a hard floor. Every scenario sits above it. The base case (5.9 M) implies about 2.1x as many kids play soccer as are captured in registration data.
Estimate range: organized core to high case
Bars scaled to high-case estimate. Organized core is the registration floor.
Out of every 100 U.S. children
8 out of every 100 U.S. children play soccer under the base case (8%) scenario.
| Metric | Conservative | Base Case | High |
|---|---|---|---|
| Estimated players | 4.4 M | 5.9 M | 7.4 M |
| 11-player teams | 402,555 | 536,740 | 670,925 |
| 18-player rosters | 246,006 | 328,008 | 410,009 |
| Q2 Stadium sellouts | 214 | 285 | 356 |
| Mercedes-Benz sellouts | 104 | 139 | 174 |
| Fields at once | 201,277 | 268,370 | 335,462 |
How big is that, really?
5.9 M kids is a hard number to picture. That is roughly the entire population of Colorado. Or picture the San Diego metro area - every person in San Diego, Chula Vista, Carlsbad, Oceanside, all of it - and then do it again. You would need 1.8 San Diegos to seat them all.
Here are some other things you did not ask for but are getting anyway.
- If every soccer-playing kid needed a ride to practice, you would need 984,023 minivans (six kids per van, one exhausted parent driving). That is roughly one minivan for every gas station in America. Soccer moms are not a demographic. They are an army.
- Line up 123,003 yellow school buses bumper to bumper and the convoy stretches about 815 miles - roughly Los Angeles to Seattle and back.
- Halftime orange slices for every kid: 1,476,034 oranges, sliced into 11,808,272 pieces. That is more oranges than Florida produces in a bad frost year. Someone has to cut all of those.
- Post-game juice boxes, laid end to end: 606 miles. That is roughly New York to Denver. In Capri Suns.
If you prefer your scale references in regulation soccer terms: you could field 536,740 full 11-player teams simultaneously, or cover 268,370 pitches at once with 22 players on each. Toggle between scenarios below to see how the numbers shift.
Stadium reference points
Q2 Stadium
Austin FC
- ●Capacity: 20,738
- ●Sellouts needed: 285
Lower.com Field
Columbus Crew
- ●Capacity: 20,371
- ●Sellouts needed: 290
Mercedes-Benz Stadium
Atlanta United
- ●Capacity: 42,500
- ●Sellouts needed: 139
One in every 13
Under the base case, roughly 1 in every 13 American children plays soccer. That ratio holds whether you are thinking about a classroom, a neighborhood, or a county. If a school has 500 students, about 38 of them play soccer in some form - many of them outside the organized systems that produce registration numbers. At least one of them has strong opinions about Messi.
How many have ever played organized?
Everything above estimates active participation from the current source window. But the organized registration pool turns over. Kids sign up for a few seasons of rec league, play travel for a couple of years, or age out of AYSO. The 2.8 M organized core is a snapshot - the cumulative number of children who have passed through organized soccer at some point during childhood is much larger.
If the average kid stays in organized soccer for 4 years, then over an 18-year childhood window roughly 4.5x as many unique children cycle through the system. That puts the cumulative organized total at about 12.7 M - kids who have been registered with USYS or AYSO at some point, even if they are not in the active pool.
Assumption: average tenure. USYS and AYSO do not publish average registration duration. We bracket with 3, 4, and 5 years. A 3-year tenure (common for casual rec players who try a few seasons) produces 16.9 M. A 5-year tenure (more typical of committed travel players) produces 10.2 M. The 4-year base case (12.7 M) splits the difference.
Cumulative organized players by tenure assumption
Bars scaled to shortest-tenure estimate. "Currently registered" is the annual snapshot; tenure scenarios estimate unique children over an 18-year childhood.
What we do not know
This is an estimate, not a census. The participation rates come from national surveys with their own sampling limitations. The overlap factor between USYS and AYSO is our assumption - the organizations do not publish cross-registration data. We do not account for age distribution within the under-18 population (soccer participation likely peaks in the 6-12 range and declines in the teen years). And we define "plays soccer" broadly - the conservative case is closer to "plays regularly," while the high case includes kids who kicked a ball twice at a birthday party.
Still, the estimate is grounded in real inputs. The Census population is authoritative. USYS and AYSO publish their registration numbers. The participation rate range (6-10%) is consistent across multiple survey sources. The organized core of 2.8 M is a hard floor that no scenario violates. Even the conservative estimate (4.4 M) is more than double the organized registration count. And on any given afternoon, a kid is scoring the winning goal against a recycling bin. We are not counting that kid. But we probably should be.